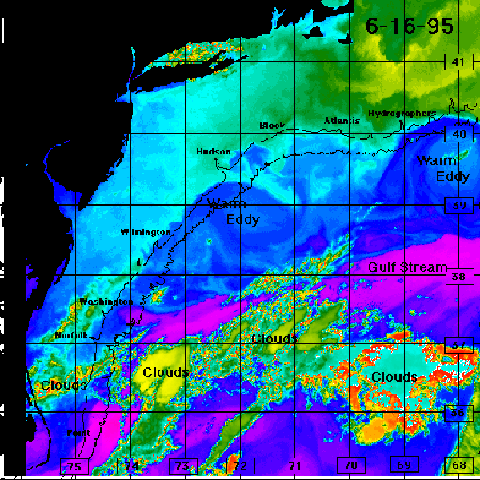
Satellite Generated / Computer Enhanced High Resolution Ocean Temperature Charts
Cape Cod to Cape Hatteras Service

This image was generated from NOAA 12 on 10-7-97. This image is color enhanced and is not an accurate representation of water color. Warmest water is shown in pink and cold water ranges from yellow to orange, red representing very cold. Warmer water ranges from purple to dark blue to green. Clouds, being extremely cold range in color from yellow to red and are marked accordingly.
NORTHEAST REGIONS
Inside The 50-Fathom Curve
Region 1: New York & New England
Region 2: New Jersey
Region 3: Delmarva
Three inshore areas are provided. Region 1: New York & New England. Region 2: New Jersey. Region 3: Delmarva. If you live in either New York or New England, Region 1 will provide you inshore ocean temperature out to the 50-fathom curve. Region 2 will give New Jersey anglers the temperature information required and Delmarva fishermen should use Region 3 charts for information on the inshore areas they fish.
CANYON CHARTS
Hydrographers Canyon
The chart provided for this area show Hydrographers, Lydonia and Oceanographers canyons.
Block, Atlantis & Veatch Canyons
Two charts cover these northern canyon regions.
Hudson Canyon
The Hudson Canyon chart covers the Hudson to Toms canyons.
Toms Canyon to Spencer Canyon
This area chart covers all the smaller canyons from the Toms to the Spencer including the Carteret Canyon and Lindenkohl Canyon.
Wilmington Canyon to Baltimore Canyon
The Wilmington Canyon to Baltimore Canyon chart starts at the Wilmington Canyon and covers the area just north of the Wilmington to just south of the Baltimore Canyon and offshore beyond the 1000-fathom curve.
Poormans to Washington Canyons
This region provides ocean temperature information for the Poormans, South Poormans and Washington canyons.
Norfolk Canyon to The Point
Norfolk Canyon south to the Point off Oregon Inlet, North Carolina.
Hatteras Offshore
Two area charts cover the waters offshore of Diamond Shoals between Oregon Inlet and Hatteras Inlet and South to Cape Lookout continuing out beyond the 1500-fathom curve.
INFORMATION
How to Read and Use these Charts
If you've never used sea surface temperature charts before this page offers a short tutorial on how to properly read and use the charts. These pages illustrate how the charts are produced, and describes how the charts can be used as a tool to maximize your fishing productivity.

