Inshore Region 1: New York/New England
Southeast of Chatham
Southeast of Chatham (Turbidity Image)
Region 1 East
Region 1 East (Turbidity Image)
Region 1 West
Region 1 West (Turbidity Image)
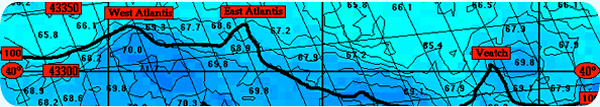
The Southeast of Chatham and Region 1 charts provide ocean temperature information, along with circled potential hotspots and super enlargements (if there are areas of interest that can be clarified with a blow-up of the region), for the area Southeast of Chatham to Long Island and from Long Island to Atlantic City out to the 50-fathom curve.The Southeast of Chatham chart, Region 1 East chart, and the Region 1 West chart are prepared daily.